Methodology:
GASTAT implements all its statistical works in accordance with a unified methodology that comply with the nature of each statistical product. It relies on the Manual of the Statistical Procedures which conforms with the procedures adopted by the international organizations. The statistical product goes through eight connected stages, in addition to a ninth stage (the comprehensive "management" stage), which are as follows:
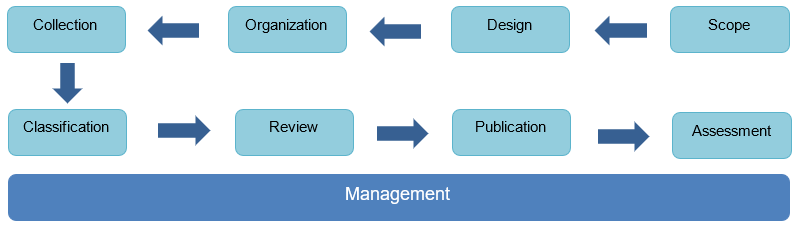
The first three stages: (Scope, design, and organization) are collaborative stages between GASTAT and its clients from the different developmental entities. However, the fourth stage (Data collection) is a collaborative stage between GASTAT and the statistical community either households or establishments, in order to complete data and information. On the other hands, the rest of the stages are considered statistical stages carried out by GASTAT, including (Disaggregation, revision, and publication). After that, the eighth stage (Evaluation) is done through collaboration with clients again, whereas the (Management) stage is an administrative and the organizational stage is connected with all stages. These stages have been applied on the Household Environment Survey as follows:
First stage: scope
The first step in the process of producing (the Household Environment Survey). It is also the first collaborative stage between GASTAT and its partners, namely (the General Authority for Meteorology and Environmental Protection, Ministry of Environment, Water and Agriculture, and Ministry of Municipal and Rural Affairs). At this stage, workshops and meetings have been held between GASTAT and these bodies to reach an understanding of their needs and to identify their requirements as providers and users of data at the same time. The feedback of these bodies have been taken into consideration to ensure the achievement of all Household Environment Survey's objectives, which can be summarized as follows:
- Providing environmental statistical data that helps in measuring some sustainable development indicators related to the environment, based on international definitions of these indicators.
- Providing statistical data that serves the making of environmental statistics report, which is based on The Framework for the Development of Environment Statistics (FDES 2013).
- Providing some data on water and waste to help in filling out the international questionnaires of the United Nations Statistics Division, that are required to be filled out periodically.
- Raising environmental awareness related to saving water and energy through the use of energy and water saving products.
- Raising awareness of waste sorting, environmental education, and the best way to dispose of electronic waste.
- Providing an environmental database of interest to decision makers in developing appropriate environmental policies.
At this stage, we have made sure that all published statistics contribute to meeting the requirements of Saudi Vision 2030, and attend to regional requirements such as water and waste data required by GCC-STAT, as well as the international requirements related to sustainable development indicators of the United Nations Commission.
Second stage: design
The stage of designing the statistical work as a whole product. Through this stage, the statistical community is determined, statistical framework, survey sample, and questionnaire are designed, methods and tools of data collection are identified, and sampling units are specified. Clients collaborate in all these procedures to benefit from their feedbacks, so that all requirements can be achieved within the statistical product. The most important outputs of this stage are:
2.1 Statistical community
The statistical community of household environment survey consists of all individuals (Saudis and non-Saudis) who habitually live in Saudi Arabia.
2.2. Statistics sources:
The publication data is derived from the (Household Environment Survey); a survey performed by GASTAT on an annual basis, which was conducted for the first time in 2019 under the (Spatial Statistics and Resources Statistics). The survey is designed to collect information by contacting by phone a representative sample of the households across the Saudi administrative regions. An online questionnaire will be used to provide estimates, indicators and accurate, detailed data on the household environmental sector in order to support decision makers. The data will identify household environmental behaviors and environmental awareness and support gaps, fulfill the environmental data requirements of public and private entities and understand the household environmental situation in the kingdom. This will help identify the ease of access to of water and sewage services, household production of organic and hazardous waste. This will, in turn, allow for the optimal planning of environmental awareness, mitigation of certain environmental issues, thereby benefiting the society and economy as a whole; as well as the provision of environment statistics that will help measure environment-related SDG indicators based on the international standards, assisting decision-makers to develop optimal plans.
2.3. Survey terminology and concepts:
- Environmental pollution: Environmental pollution is defined as the contamination of the physical and biological components of the natural environment to such an extent that humans and other living organisms are adversely affected. Pollutants can be solid, fluid or gaseous; as well as naturally occurring substances, but they are considered contaminants when in excess of natural levels. It can result in pollution of air, water, and land.
- Light pollution: Light pollution, also known as photo pollution, is the excessive use of artificial light, resulting in the alteration of natural conditions, which adversely affects the health and safety of humans, wildlife and plant growth, increases energy usage, and distorts ecosystems. Among the causes of light pollution is: the excessive use of neon signs, decorative lights, too strong street lights, leaving the lights on in unused rooms, and overpopulation, which leads to a large number of light sources in a small area.
- Sound pollution: The propagation of noise with harmful impact on the activity of human or animal life. Sound pollution is measured in decibel (dB), where the permissible limit according to WHO is 75 dB. Noise at (90) dB can cause hearing damage, whereas a noise louder than (100) can cause complete hearing loss. Potential sound pollution sources are factory machines, such as grinders, generators, compressors... etc; social music and dance events; transport, such as trains, planes, cars; various construction activities, such as constructing bridges, dams, buildings and roads; household activities producing loud noises, such as the TV, pressure cookers, vacuum cleaners, washing machines, dryers, ACs, etc.
- Air pollution: Air pollution is a mixture of solid particles and gases in the air in amounts that can physiological, economical and biological harm to humans, animals, plants, and machinery and alter nature.
- Visual pollution: Visual pollution is an aesthetic issue and refers to the impacts of pollution that impair one's ability to enjoy a vista or view.
- Water cost: The administered price of water provided through supply pipes by public and private facilities (water fees, including sewage fees).
- Waste: Waste is any substance which is discarded after use, except recycled or reused materials. Its numbers are on the rise in developing countries, especially where there is overpopulation. Without public health awareness, waste can lead to many hazards. It has four types:
- Organic waste: Biodegradable materials, such as food and garden waste.
- Inorganic waste: Non-biodegradable substances, such as plastic, minerals and fabrics.
- Household non-hazardous waste: Household waste that can be categorized under the following types of waste: organic, plastic, mineral, and agricultural.
- Household hazardous waste: Household medical and chemical waste, such as blood, tissues, needles, gauze, used bandages, detergents, paint, pesticides and foggers.
- Waste Sorting: Waste sorting is the process by which waste is separated in boxes in different colors into organic waste (later turned into fertilizer), paper, minerals and glass, which helps recycle the waste.
- Organic products: Organic products are products that are free from GMOs and chemicals (such as preservatives and artificial flavors). Farmers use natural fertilizers for this kind of products to improve their produce. They are divided in two categories:
- Organic animal products: made from animals that are raised without the use of antibiotics or synthetic growth hormones.
- Organic plant products: made with organic farming, which does not use industrial fertilizers, pesticides containing chemicals, or genetically enhanced or modified materials.
- Environmental interest: A layperson’s understanding, skills and motivation towards his or her relationships to natural systems, including, for instance, the different kinds of pollution and awareness of environmental problems.
2.4. Indicators:
|
Indicator |
Indicator description / measurement |
|
Percentage distribution of households suffering from pollution by type (visual, sound, light, air). |
It is measured by asking households in the survey sample about the type of pollution they suffer from (visual, sound, light, air). Then, the ratio of households suffering from pollution to total households in the sample is calculated and weighted. |
|
Percentage of household dependence on the public network |
It is measured by asking households in the survey sample about their water source (public network, pipe, well, other), then finding out and weighting the (percentage of households depending on public network to total survey households) each source. |
|
Percentage distribution of the main wastewater source. |
It is measured by asking households in the survey sample about their wastewater source (public network, private network, plant, other), then finding out and weighting the percentage of each source. |
|
Percentage distribution of types of toilets in households. |
It is measured by asking households in the survey sample about the type of toilets they have then weighting the percentages. |
|
Percentage distribution of household waste sorting. |
It is measured by asking households in the survey sample if they sort their waste, then finding out and weighting the (percentage of households practicing sorting waste to total survey households) each source. |
|
Total produced waste in tons in KSA. |
It is measured by asking households in the survey sample about the amount of waste they produce weekly (in kg), then calculating and weighting the annual amount in kg. |
|
Percentage distribution of household disposal of electronic waste (public garbage containers, insinuation, selling, handing it to recycling entities). |
It is measured by asking households in the survey sample about their method of disposal of electronic waste (public garbage containers, insinuation, selling, handing it to recycling entities), then identifying and weighting the percentages of methods. |
|
Percentage distribution of most used saving devices in households. |
It is measured by asking households in the survey sample about their saving devices (water saving devices, energy saving lamps, energy saving electric devices, others), then identifying and weighting the percentage of households using energy saving devices to total survey households per device. |
|
Percentage distribution of the types of used coal and firewood. |
It is measured by asking households in the survey sample about the type of coal and firewood they use then weighting the percentages. |
|
Percentage distribution of households buying organic products. |
It is measured by asking households in the survey sample if they buy organic products, then finding out and weighting the percentage of households buying organic products to total survey households. |
|
Percentage distribution of household environmental interest. |
It is measured by asking households in the survey sample about their environmental interest, then determining and weighting the level of environmental interest. |
|
Many indicators and data provided by the survey can be reviewed in the publication tables. |
|
2.5. Adopted statistical classifications:
Classification is defined as an arranged set of related categories used for data collection based on similarity. It is the basis for collecting and publishing data in all statistical fields, such as economic activity, products, expenditures, jobs or health, etc. It allows for classifying data and information into meaningful categories to produce useful statistics. That being said, data collection requires precise and methodological arrangement based on their commonalities as to produce reliable and comparable statistics. In this survey, the International Standard Classification of Education (ISCED) was used to classify the levels of education.
2.6. Survey questionnaire design:
The survey form was prepared and designed by household environment survey experts at GASTAT. International recommendations, standards, and definitions were taken into consideration in the design of the survey, which was also presented to experts and stakeholders to obtain their insights and comments. Questions were then redrafted based on a specific scientific approach aimed at unifying question formats used by researchers.
|
The questionnaire was divided into eight thematic sections to increase the efficiency of the questionnaire to achieve the technical specifications for data collection stage, as follows: |
|||
|
Geographic and distinctive data |
Household data |
Housing data |
Water data |
|
Sewage data |
Waste data |
Energy data |
General environmental data |
|
The complete questionnaire can be viewed and downloaded through GASTAT’s official website: |
|||
Upon approval, the survey questionnaire was converted into an electronic questionnaire that can be used on an advanced data collection system on computers. The system has the following features:
- Reviewing the researcher’s work zone.
- Contacting the household using the telecommunication system (Cisco Jabber).
- Collecting data of high quality using data checks and navigation services (to automatically detect input errors and illogical inputs during the collection of data).
- Allowing for communication between the supervising entities through the exchange of notes with researchers.
2.7 Coverage:
Spatial coverage:
The Household Environment Survey data covers households across the 13 administrative regions of the Kingdom of Saudi Arabia, which are: (Riyadh, Makkah, Madinah, Qassim, Eastern Province, Asir, Tabuk, Hail, Northern Borders, Jazan, Najran, Al-Baha, and Al-Jouf) by communicating a scientifically selected sample representing the region’s households in each region.
Temporal coverage:
· Household profile data, housing characteristics, and household data is determined at the time of the researcher’s contact with the household.
· Data related to water, waste and energy is attributed to the last 12 months preceding the researcher’s contact with the household.
2.8. Statistical framework of Household Environment Survey:
- The framework of buildings, real estate units numbering process 2020 was used as a list that contains all the population's individuals.
· Lists, maps and analytical standards of the units were developed for the selection of data providers (households).
· The required descriptive data were identified in order to create and verify the statistical framework and test framework and then used in the current survey round.
2.9. Sampling design:
- The survey population was divided into non-overlapping parts characterized by the homogeneity of their units. Every part was considered a layer, and every layer was treated as an independent population.
- A random sample was drawn separately from every layer. At the end, all drawn sampling units were integrated to form the total sample.
- The sample units were selected from the statistical frameworks designed to cover the target statistical population in two stages. In the first stage, the primary sampling units (enumeration area) resulting from the process of buildings, real estate units numbering were selected. Using the regular random sampling, (1250) enumeration areas were selected from the main sample totaling (9560) enumeration areas divided into all layers in the administrative regions in the Kingdom and weighting the number of Saudi households. In the second stage, the final sampling units were drawn from the statistical areas, which are the households in the enumeration areas that were chosen in the first stage using the regular random sample. (24) households were chosen from each enumeration area, totaling (30,000) households at the Kingdom level.
- The optimal sample unit selection methodology was prepared with the aim of providing high-quality outputs and reducing burden on data providers using statistical methods recognized by the statistics specialists, such as methods of rotation and overlap control.
- The descriptive data required for establishing the statistical framework was selected and the sample was specified.
- The sample was then tested, evaluated, validated and used in the current survey round.
Sampling Units of the Household Environment Survey:
The primary sampling units are the enumeration areas. They are sampling units drawn in the first stage of designing the survey sample. Households are considered secondary and ultimate sampling units at the same time. They are sampling units drawn in the second stage of designing the survey sample. Each secondary sampling unit is considered a part of the basic sampling units.
3. Third stage: organization
It is the final preparation stage preceding the contact with households and data collection. In this stage, the required workflow procedures are established for preparing the Household Environment Survey, starting with the "collection stage" and ending with the assessment stage and the organization and grouping of such procedures. The optimal sequence of those procedures is chosen to arrive at a methodology that achieves the objectives of Household Environment Survey. In this stage, the procedures adopted when preparing the previous version of Household Environment Survey have been reviewed in order to develop work procedures in this version. Those procedures were also described and documented to facilitate any updates to them in future rounds. The statistical workflow procedures were tested and examined to ensure their compliance with the requirements of preparing the Household Environment Survey Publication in its final form, approve the procedures of the statistical workflow, and develop a roadmap for implementation.
Testing the efficiency of input systems and the process of transmitting, synchronizing and reviewing data through the office system of the finance and insurance survey are the main procedures of this stage.
Fourth stage: collection
First: The survey sample was chosen by identifying 30,000 households as a selected sample that represents the survey population at the level of the Kingdom and is distributed among the administrative regions as follows:
|
Administrative region |
Number of households |
Administrative region |
Number of households |
Administrative region |
Number of households |
|
Riyadh |
4,800 |
Asir |
2,424 |
Najran |
1,440 |
|
Makkah |
5,136 |
Tabuk |
1,800 |
Al-Baha |
1,152 |
|
Madinah |
2,448 |
Hail |
1,536 |
Al-Jawf |
1,344 |
|
Qassim |
1,440 |
Northern Borders |
888 |
Total |
30,000 |
|
Eastern Province |
4,032 |
Jazan |
1,560 |
Second: The workers who were nominated as researchers and they communicated with households to collect the Household Environment Survey data based on practical and objective standards related to the nature of the work, such as:
- Educational level.
- Previous experience in Household Survey.
- Personal attributes, such as: good conduct, good senses and physical and psychological fitness.
- Candidate’s success in the training program of the Household Environment Survey.
- The candidate must not be under 20 years old.
Third: All candidates nominated for work were qualified and trained to collect the survey data as follows:
- A training program was held for researchers. It included providing guidance and outreach lectures in which the instruction manual is explained; objectives of the survey and the method of data collection are defined; and a detailed explanation of all form's questions is provided.
- A practical explanation on how filling out data of the survey's electronic form was conducted.
The researchers' performance was also tested and evaluated during training, and their comprehension of the form was checked before starting the process of contact and data collection.
The training programs offered to researchers tasked with collecting the household environment survey data include practical and hands-on lectures on the technical, technological, administrative, and awareness materials used in the data collection processes. Field researchers were also introduced to the survey goals, data collection method. The training programs also included a detailed explanation of all questionnaire questions, as well as any technical and administrative tasks. Field researchers are also trained on how to deal with the public and how to ask the questions in record time.
Fourth: Direct contact with the household was adopted to complete the survey questionnaire and collect data. Each researchers contacted the households located within the survey sample. The method of direct contact with the household has been adopted in completing the questionnaire and collecting data. The researchers tasked with this process conduct telephone calls with heads of households. Then, the researcher introduces himself, clarifies the aim of calling, gives an overview of the survey and its objective and takes permission to complete the required data directly using the Household Environment Survey electronic form. The questionnaire is then completed based on the specified timeframes. Then, the household collected data is directly uploaded, transferred and stored in the database in preparation for reviewing and handling.
Fifth: All researchers used computers to collect the survey questionnaire data according to timeframes specified based on the number of family members as well as their demographic, social and economic characteristics.
Sixth: The collected data on households is uploaded and transferred directly to the specified database at GASTAT's head office, where it is archived in a specific form in preparation for reviewing and handling later.
Seventh: Electronic check rules were applied to guarantee the accuracy, consistency, and rationality of the data entered in the survey questionnaire. These are electronic rules that identify contradictions and they were designed by using a logical link between the answers of the questionnaire and its variables to help researchers directly identify any errors upon completing the survey data with the head of the household. Those programmed rules don’t allow any mistakes to go through when an answer contradicts with another piece of information or another answer in the questionnaire.
Eighth: The collected data is verified and reviewed by the researcher, his/her inspector and the survey supervisor in the supervision area. All work areas were subject to a monitoring and reviewing process from the Data Quality Room at GASTAT’s headquarters. The room also controls and monitors the performance of all working groups during the data collection process, from the first day and until the last day.
Reviewing the collected data, and sending notes to the work teams at various levels through the office automated system linked to the researchers' computers, so that they
Fifth stage: classification
Raw data classification in the Household Environment Survey relied on the coding and categorization inputs made in the data collection phase, in which all data was classified based on educational level.
Or any other data code or category, such as geographical area (data distribution among administrative regions) or description and type, such as gender or social status.
In this stage, specialists from the Department of Environment Statistics conducted data processing and analysis based on several procedures as follows:
- Sorting and arranging data in sequences or different groups or categories.
- Summarizing detailed data into key points.
- Combining many data segments and ensuring their interconnection.
- Processing lost or missing data.
- Processing illogical data.
- Converting data into a form that has statistical significance.
- Organizing, presenting and interpreting data.
Data from the Household Environment Survey was displayed in suitable tables to facilitate summarizing, understanding and drawing conclusions, as well as comparing them to other data, observing statistical significance as they relate to the study’s population, and viewing data without the need to go back to the original questionnaire. These tables contain data such as the names and addresses of individuals, which is in violation of the principle of statistical data confidentiality.
One of the most important data processing procedures that have been carried out is “data anonymization”.
To ensure data confidentiality, GASTAT removes identifiers from the survey input fields, such as the name and address of the head of the household and other identifiers to protect people’s privacy.
Sixth stage: review
First: verifying data outputs:
After processing and tabulating data in the fourth stage and its safety was verified, GASTAT calculates and extracts the results, after which it uploads and stores them on the database. The final reviewing processes are conducted by environment statistics specialists using modern technologies and software designed for the purposes of review and audit
Second: dealing with confidential data:
Pursuant to Royal Decree No. 23 of 07/12/1397, GASTAT is committed to the absolute confidentiality of all collected data and not use it except for statistical purposes. Therefore, data is safely stored on GASTAT’s servers.

Seventh stage: publication
First: preparing results for publishing:
In this stage, GASTAT uploaded the data results from the survey database. GASTAT then prepared publication tables and graphs for the data and indicators, and added descriptive and methodological information to them. These were prepared in both Arabic and English.
Second stage: preparing media material and announcing the Publication’s publishing date:
After announcing the publication's publishing date on its official website at the beginning of the calendar year, GASTAT prepares the required media materials to announce the publication's publishing on all media outlets, as well as its social media platforms. The announcement is made on the date of publication. The publication is published on the official website in various open data formats, such as Excel, to be made available on the website’s statistics library. This guarantees circulation and provision of access to all clients and parties interested in household environment.
Third: communicating with clients and providing them with the publication:
GASTAT gives great importance to communicating with clients who are users of its data. Therefore, GASTAT contacts clients upon publishing the Household Environment Survey Publication to provide them with it. GASTAT also receives questions and enquiries from clients regarding the publication and its results through various communication channels. Clients can contact GASTAT to request data. Questions and inquiries are received via:
· GASTAT official website: www.stats.gov.sa
· GASTAT’s official email: info@stats.gov.sa
· Client support email: cs@stats.gov.sa
· Visiting GASTAT HQ in Riyadh or one of its branches across the Kingdom.
· Official Letters.
· On the statistical phone line (920020081)
Eighth stage: assessment
After the publication is published and received by all GASTAT’s clients, the clients are contacted again in this stage which allows for assessing the whole statistical process with the aim of constant improvement to obtain high-quality data. The proposed future improvements may include methodologies, processes, systems, statistical researchers’ skills and statistical frameworks. This stage is carried out in collaboration with data users and GASTAT’s clients through a number of steps:
First stage: collecting measurable assessment inputs:
Feedback is collected and documented from their sources across all stages, including those collected and documented during the collection stage, such as the feedback by data collectors and their field supervisors, in addition to data collected and documented during the assessment stage such as the conclusions specialists concerned with reviewing arrive at by checking and analyzing the data collected from the team and administrative regions. Finally, feedback presented by data users is collected and documented after publication, in addition to the outputs of monitoring media outlets or the clients’ remarks which GASTAT receives through its main channels.
Second: conducting the assessment:
Collected assessment inputs are analyzed, and the results of this analysis are compared with pre-anticipated results. Accordingly, potential improvements and solutions are identified and discussed with experts and stakeholders. In this stage, the clients’ use of the results of the Household Environment Survey and their satisfaction with it are measured. Based on that, recommendations are developed to enhance the quality of the results of the next Household Environment Survey publications.
Ninth stage: management
A comprehensive stage spanning over all the stages of producing the Household Environment Survey publication. This stage determines the general production plan, including the feasibility study, risk management, means of funding, disbursement mechanisms, as well as the development performance indicators, quality parameters, human resources map necessary for production, following up on the execution of tasks assigned to all departments in every stage, and preparing reports to ensure that GASTAT fulfills its commitments towards its clients.